

When building a high-performance engineering organization, it’s not enough to hire top talent — leaders must also keep developer experience in mind and create an environment that’s conducive to productivity. Even the most skilled developers will be hamstrung by ineffective processes and other bottlenecks that stand in the way of deploying code.
That doesn’t mean it’s easy to identify the blockers that are slowing down your team. When code is making it through to production, it’s easy to assume that your processes are functioning. Leaders often lack the visibility to pinpoint bottlenecks, and developers may be reluctant to raise their hands and voice concerns, particularly if their concerns are based on gut feel.
To effectively remove blockers and boost engineering productivity, you need data. With the right information, you’ll be able to enhance visibility and supplement gut feel, making it possible to quickly spot bottlenecks in your software development pipeline and empower developers to collaborate on effective solutions.
How to Use Data to Identify Bottlenecks in Your Processes
Used thoughtfully, data is a critical tool for identifying and refining broken processes, as well as optimizing processes that are functional, but could be even more efficient.
With the right data, you can:
- Check your assumptions. Data can provide the objective evidence necessary to challenge your assumptions about what should be working. When confronted with concrete numbers, you may find that certain ‘best practices’ are not practical for your team, or processes that seem logical on paper may not hold up in practice. For example, though Code Review can be a critical way to vet code and share knowledge across your team, there’s no one-size-fits all solution for keeping code moving quickly through the review process. With an objective look at the way PRs move through review, you’ll be able to refine your process and find the one that works best for your team.
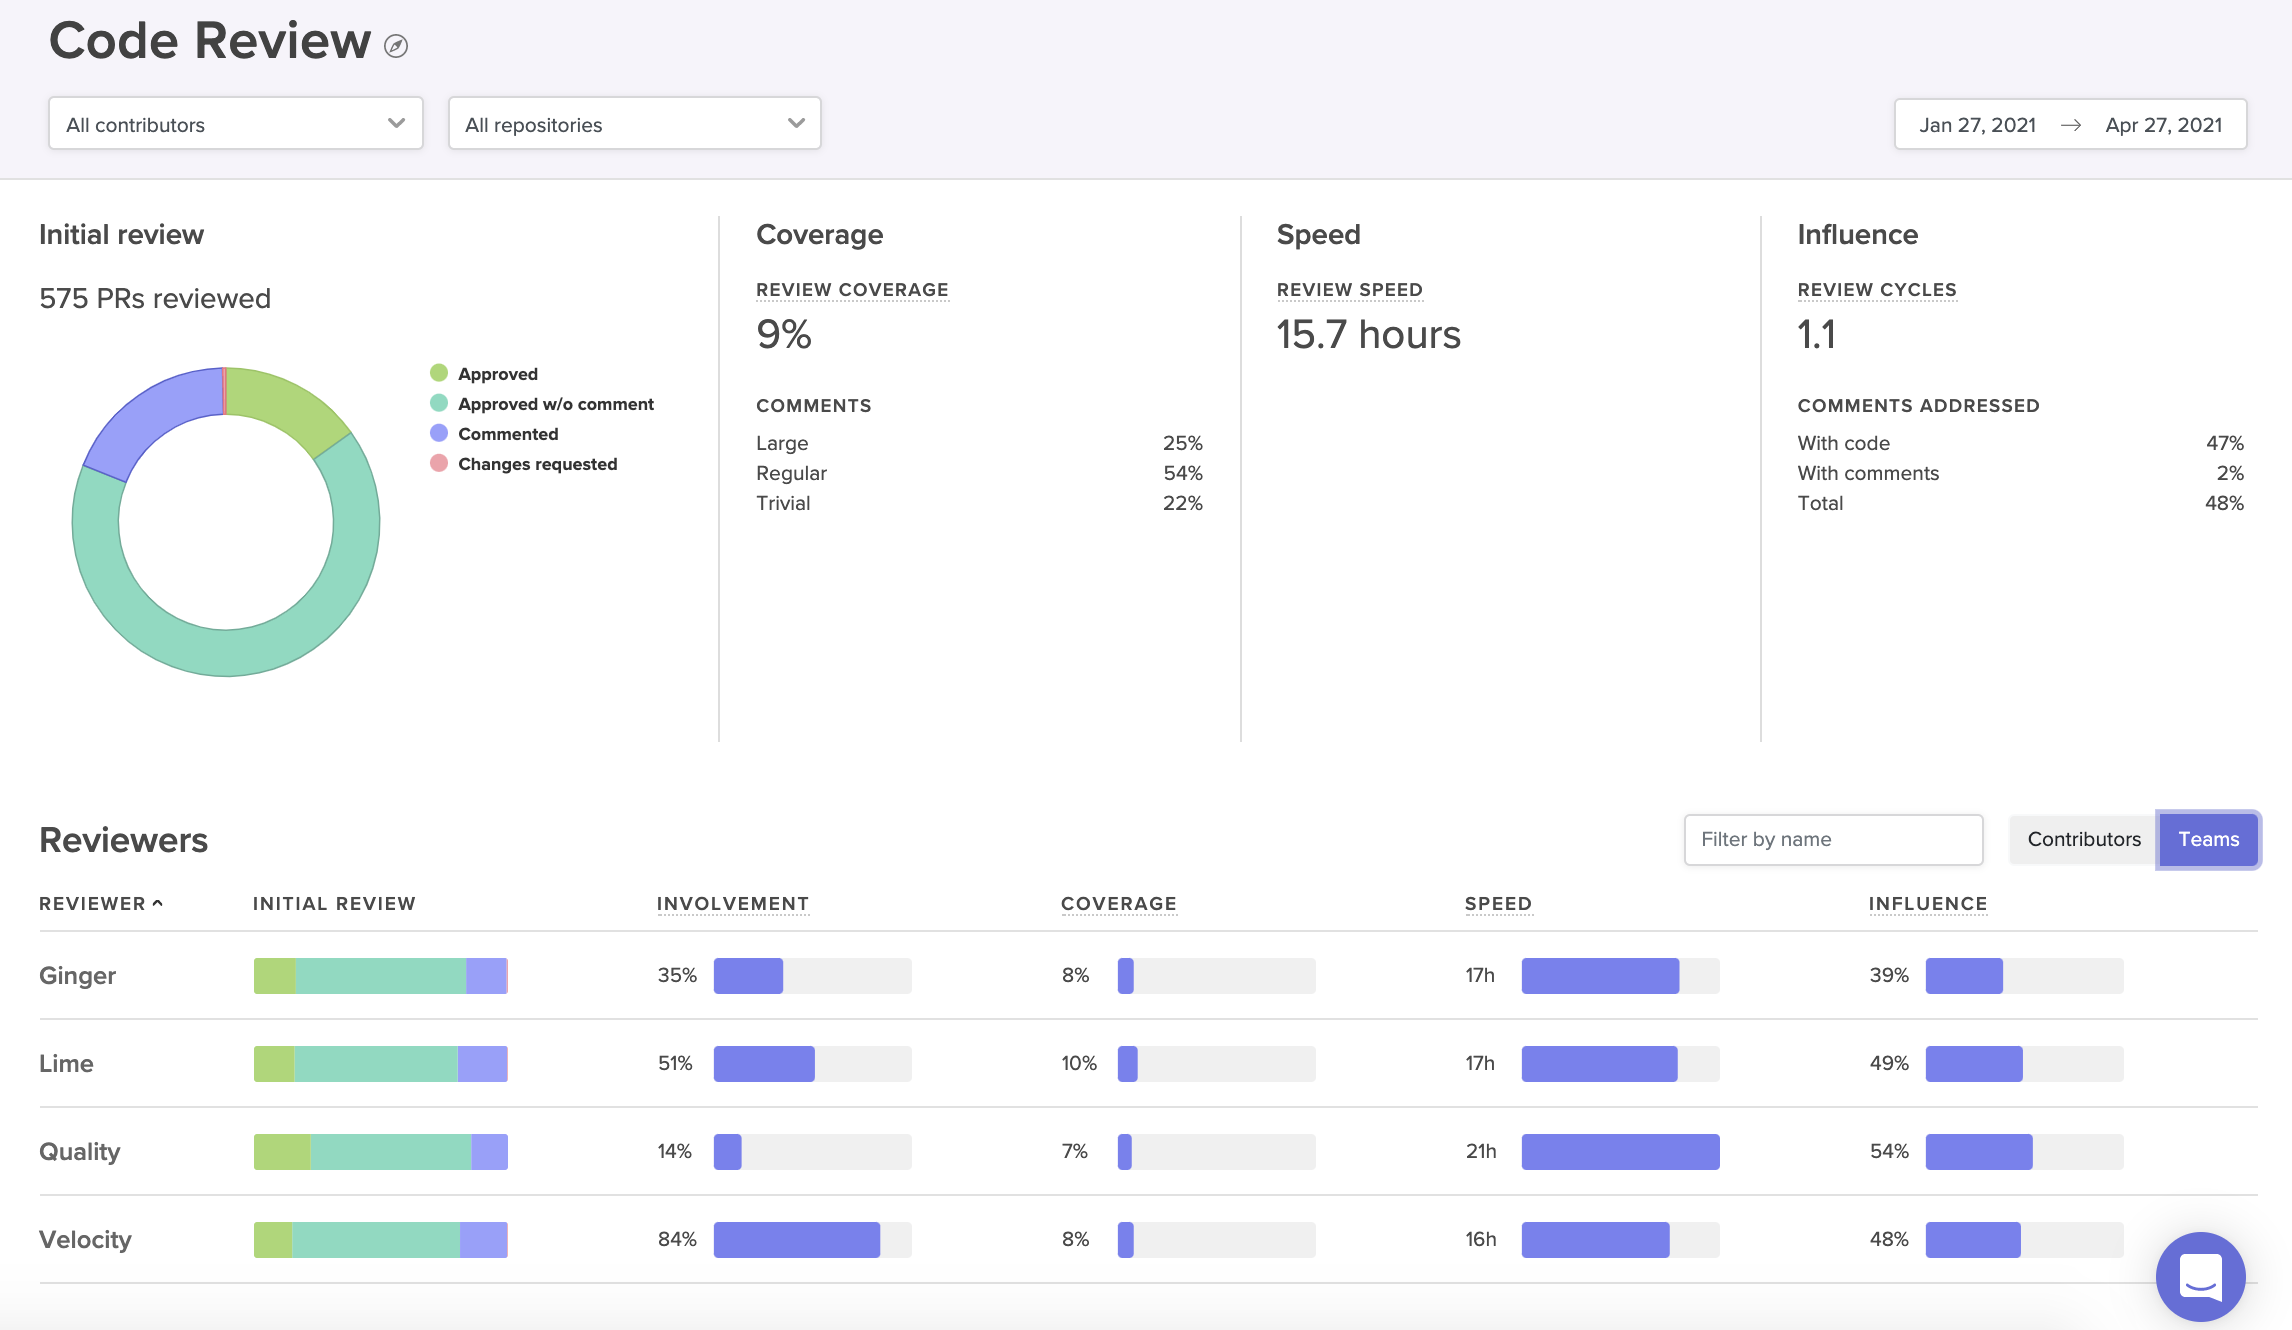
Velocity’s Code Review Report provides a visual summary of the way PRs move through your review process.
For example, some globally distributed teams prefer to allow low-impact changes to bypass the review process entirely, rather than waiting around to be approved by teammates in different timezones. One Code Climate customer dealt with a Code Review bottleneck by letting pair-programmed PRs skip review — these PRs are already well-vetted, because they’ve been worked over by two developers. This change, among others, helped the customer decrease their Cycle Time by 35% within 10 months of implementing Velocity and becoming a data-driven engineering organization.
- Look at change over time. Data makes it possible to compare your current progress to past trends. Not only will you be able to tell if your team is, in fact, moving more slowly, you’ll have the information you need to investigate each phase of development and identify the source of the slowdown. A team in the midst of a transition, like a hiring push or a switch to remote work, might find this kind of comparison to be particularly useful. Looking at key metrics before and after a big change can make it easier to identify which parts of the process are most impacted by the change and therefore most in need of attention.
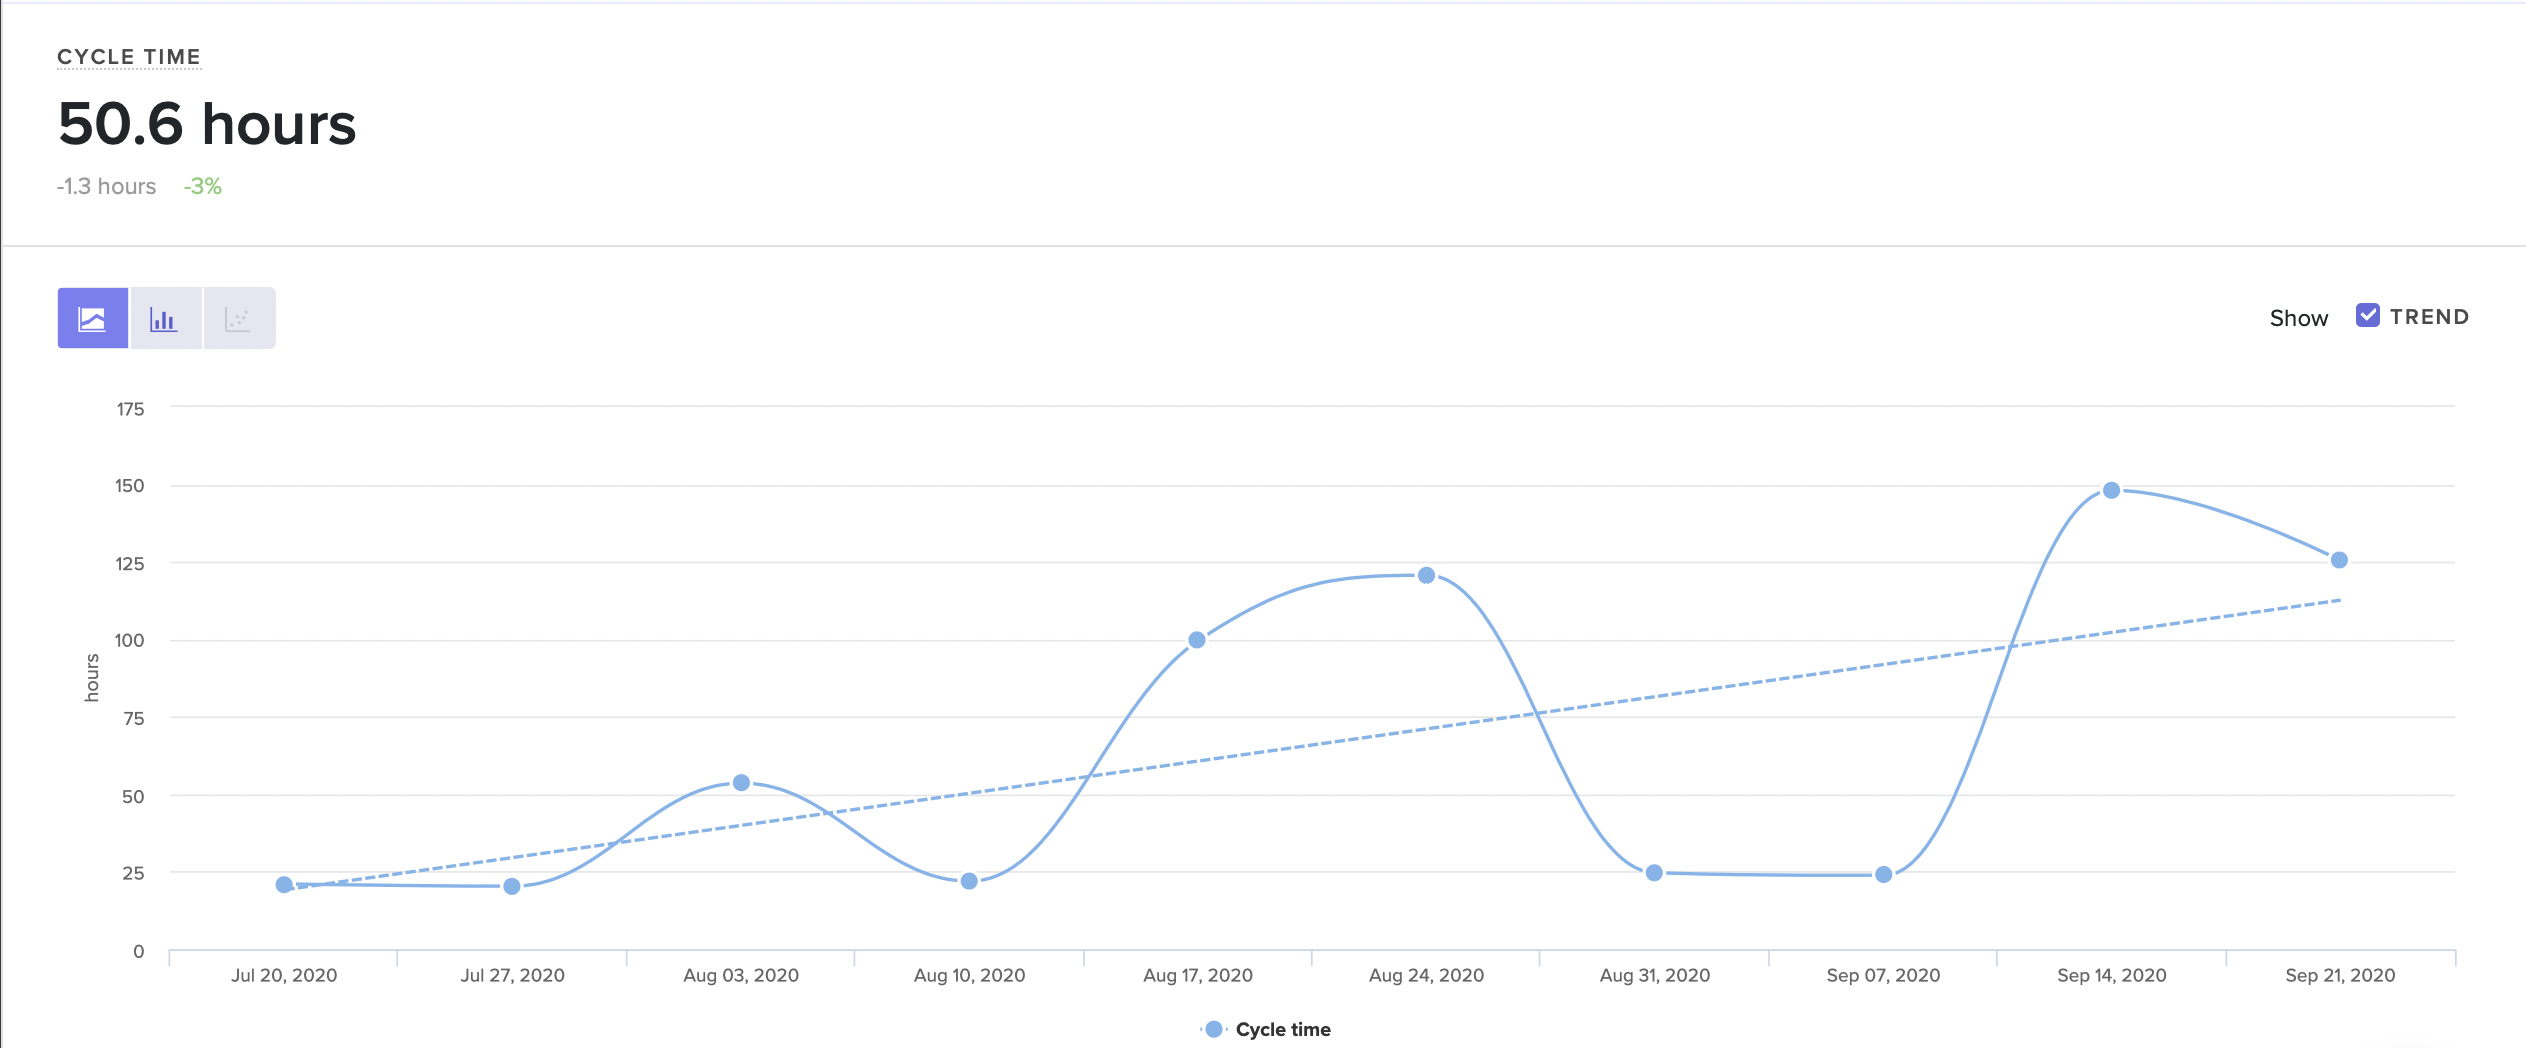
Velocity can help you visualize trends in the way your team is working.
La Haus started using Velocity to investigate a general feeling that their newly-remote engineering team was moving slowly. As Co-Founder and CTO Santiago García explains, “you can’t make decisions with a feeling.” You can, however, guide decisions with concrete data. García was able to use Velocity to identify exactly which metrics were trending in the wrong direction, design improved processes to address those concerns, and then measure their success. Improving inefficient processes more than doubled the team’s engineering speed, and La Haus’s engineers were able to cut their Cycle Time from 72 to 30 hours.
- Find opportunities for improvement upstream. Data allows you to measure and track the impact of small adjustments, some of which may have a big impact on overall productivity and efficiency. A team that’s struggling to keep code moving through Code Review could focus on refining their review process, but should first take a look at some key metrics earlier on in their pipeline. The true source of the bottleneck might not be the review process at all, but something else entirely.
Identify these impactful, early-process issues by looking at metrics like Time to Open and PR Size. Time to Open can help you spot developers who are taking a long time to open a PR, which could be a sign of anything from unclear technical direction, to a lack of time to work in the codebase. A large PR Size may signal a tendency to open large Pull Requests, which can get stuck in even the most efficient development workflow.
- Identify and scale effective processes. Data can make it easier to spot high-performing teams in your organization and determine the reasons for their success. If you look at key metrics for specific parts of the development pipeline, you’ll be able to see where your best teams are at their strongest. From there, you can borrow their most effective practices and adapt them for other engineering teams, making it possible for your teams to learn from each other and contribute to the success of the entire department.
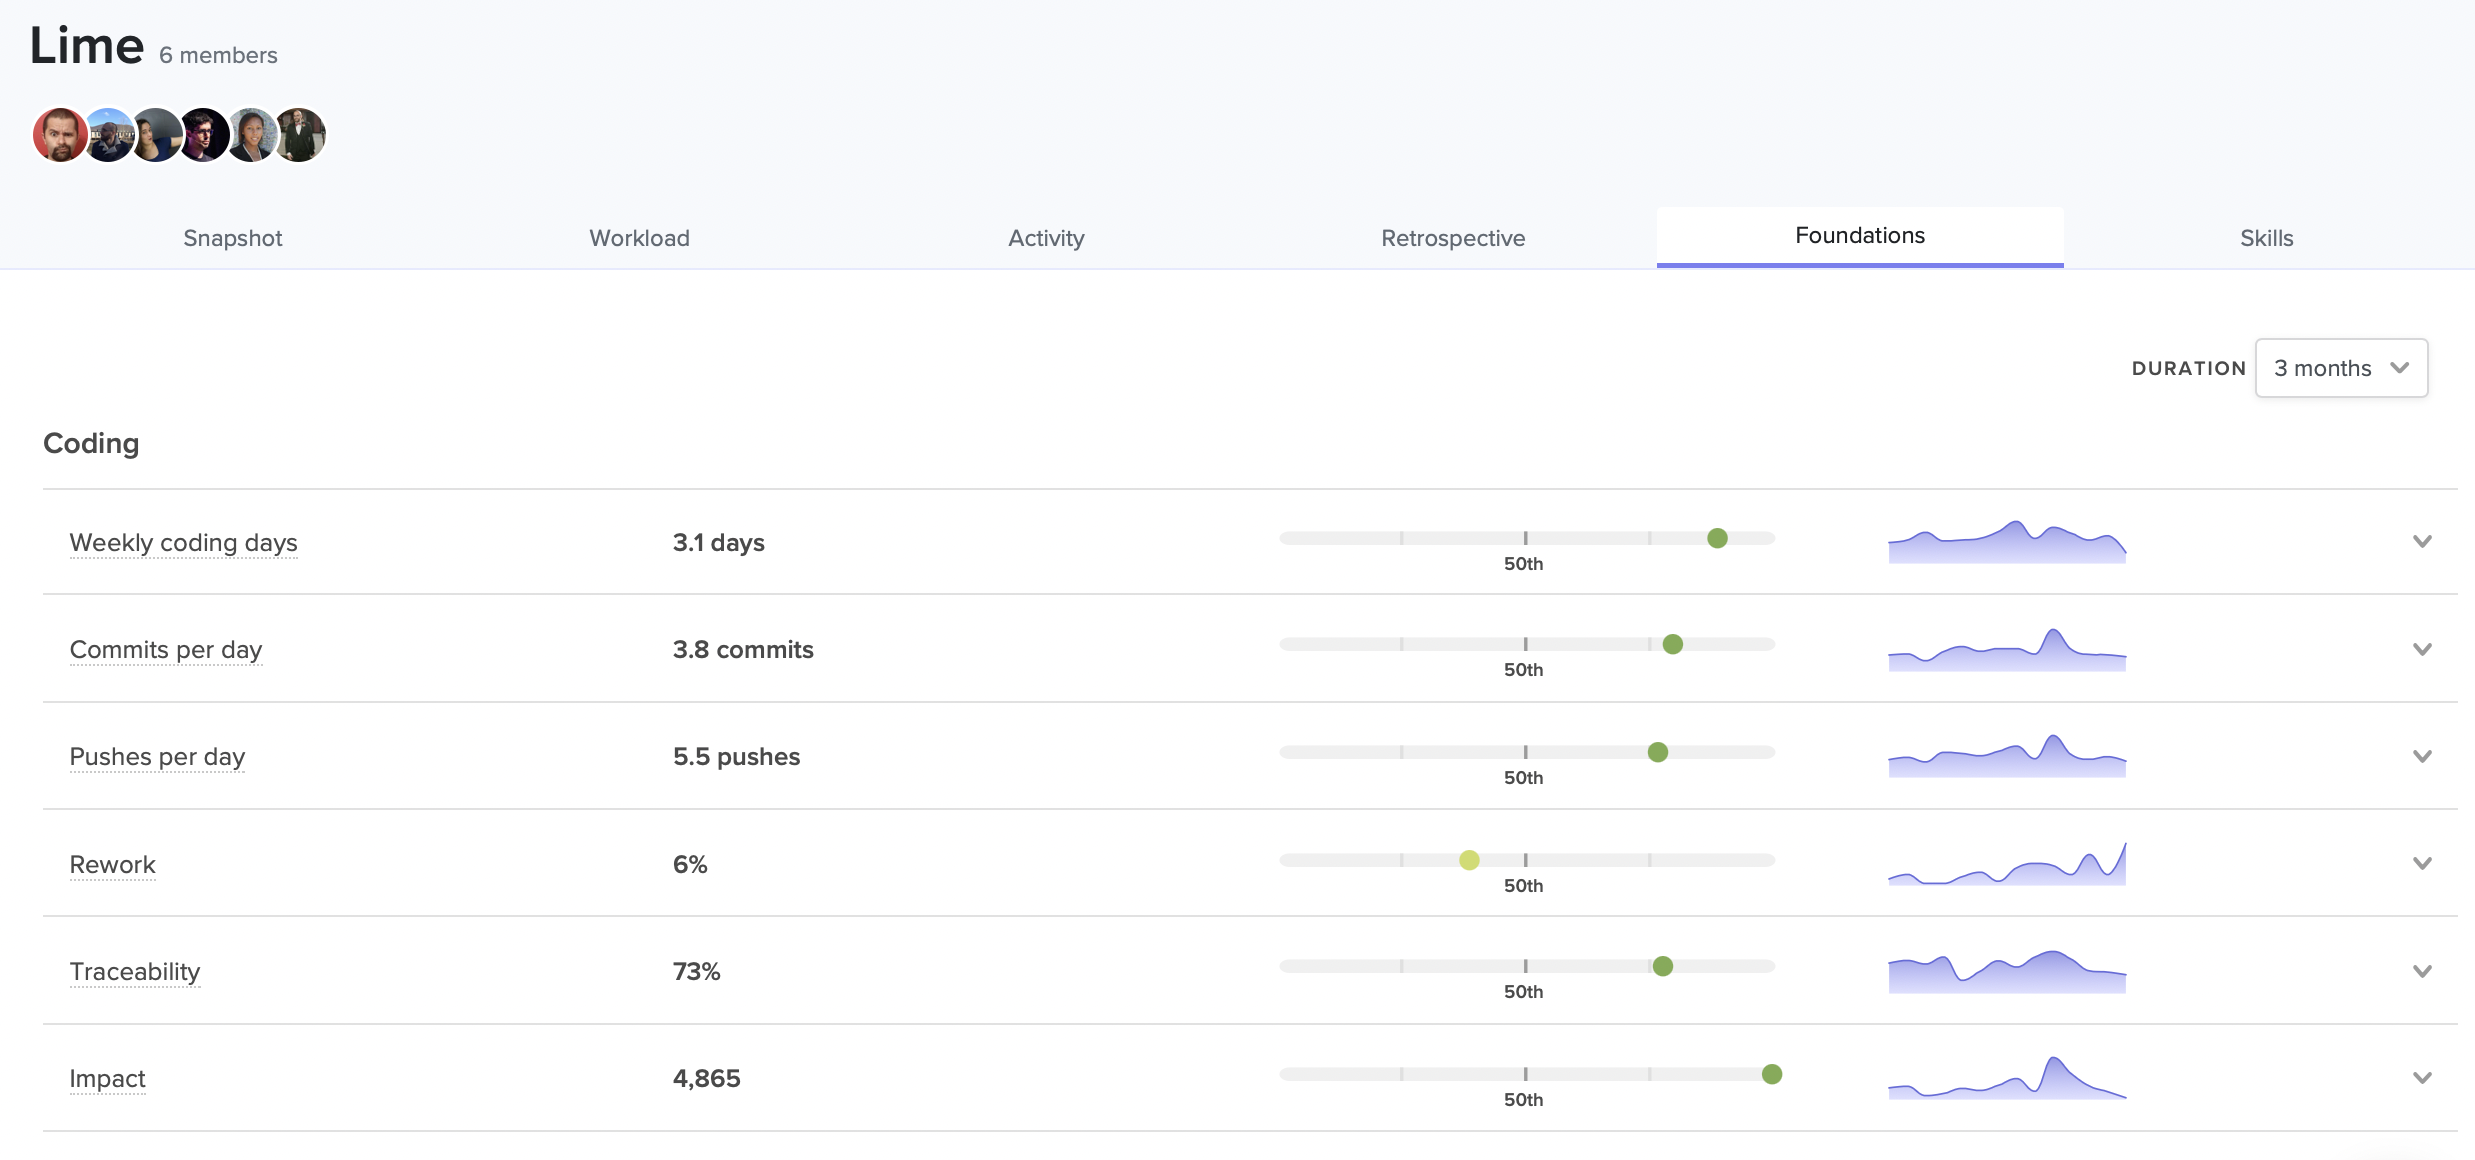
Velocity can help you see where each team excels in relation to the rest of your organization.
Roger Deetz used this strategy successfully at Springbuk. When he joined the company as VP of Engineering, he used Velocity to identify and replicate the practices of the most effective teams, ultimately boosting PR throughput by 64%. “Measurement helped us find focus. We saw what agile practices were working and shared them across teams.”
- Help individual engineers get unstuck. Data enables a granularity and immediacy that isn’t possible through stand ups and sporadic check-ins. With the proper tools, you can quickly surface at-risk work and step in with the appropriate support before it becomes a true bottleneck. For example, with Code Climate Velocity you can spot a developer who is churning, or one with a long-running PR, and help them get moving again, perhaps by clearing up a confusion with the codebase, or removing a roadblock caused by a third party.
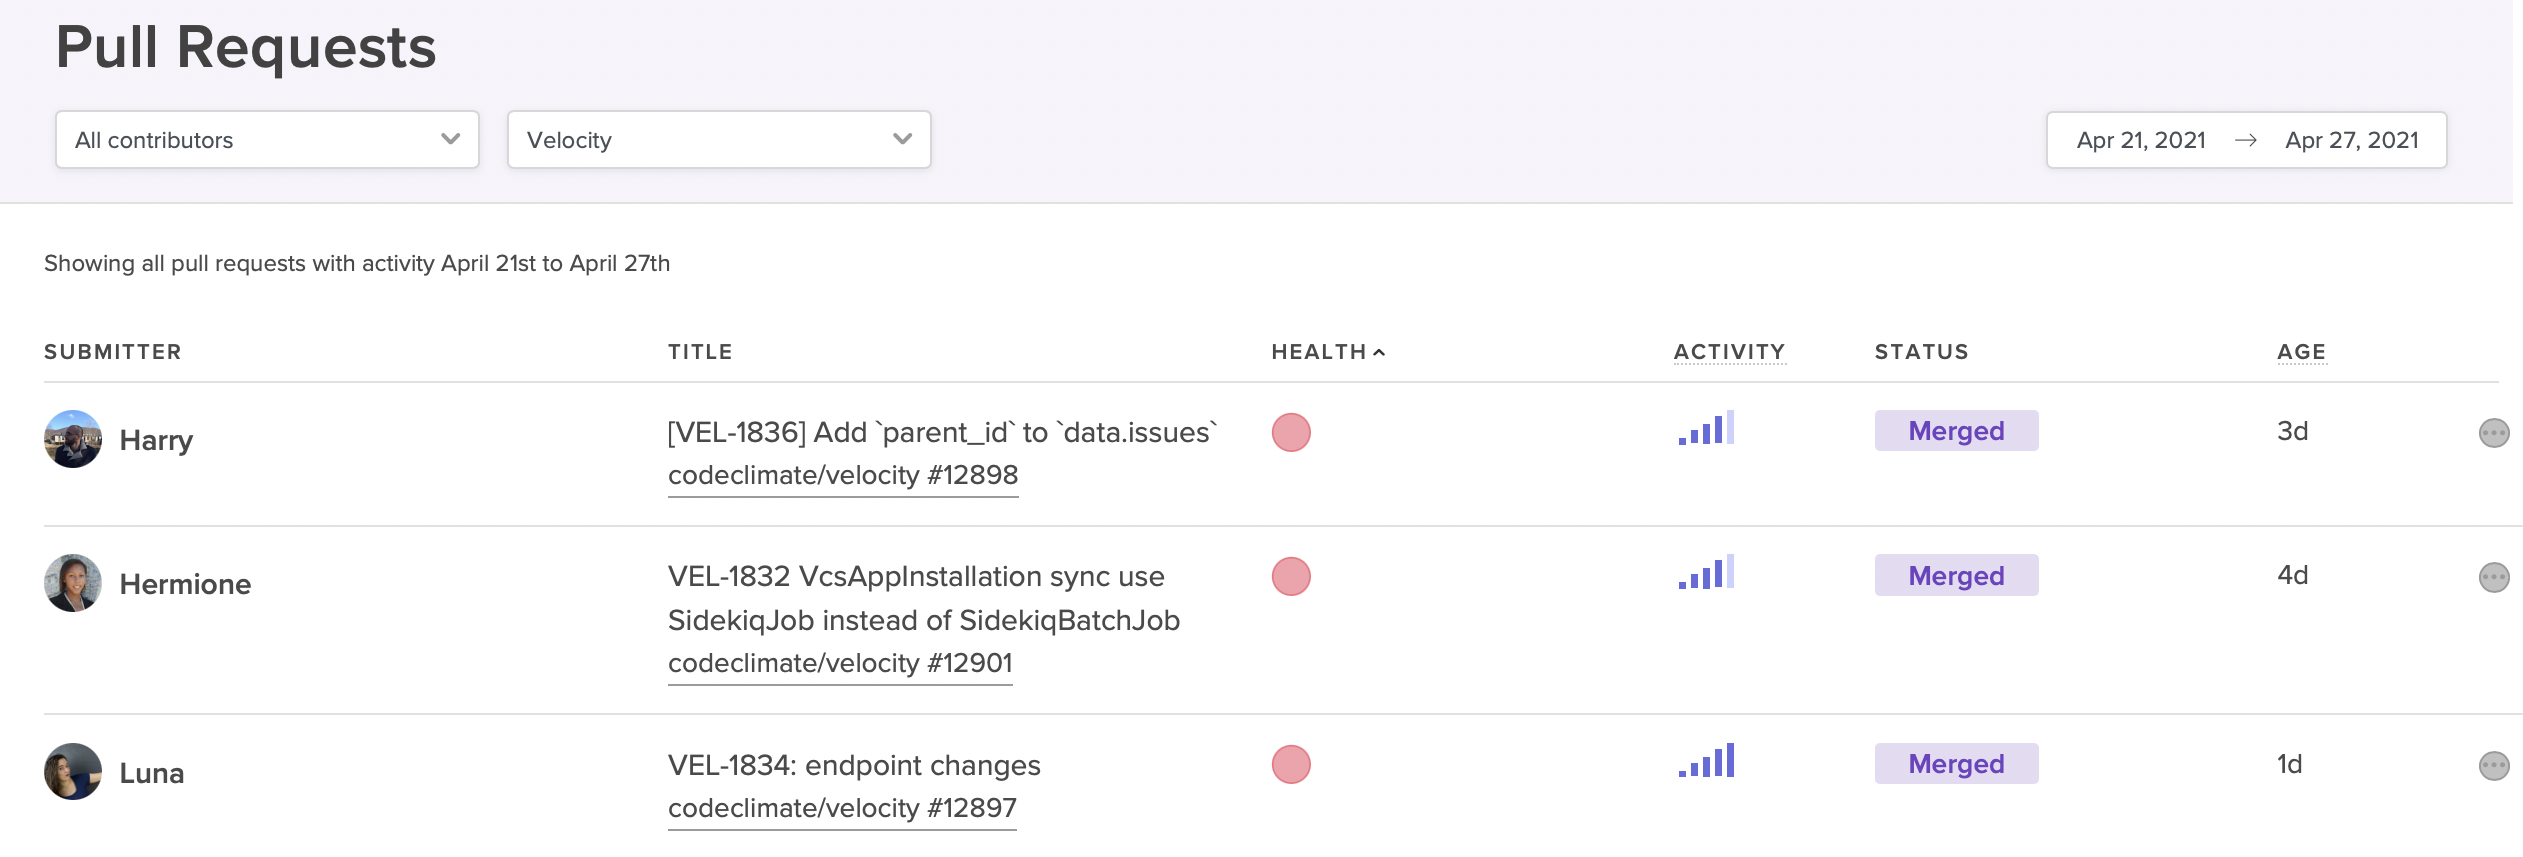
Use the Pull Requests report to view at-risk PRs that might derail your sprint.
Prioritize Unblocking Engineers With A Dedicated Team
Product features and fixes tend to get prioritized over the critical work of improving developer productivity and experience. In order to ensure that a department is making the necessary investment in removing bottlenecks and improving overall efficiency, many leaders, especially those in large organizations, will give the responsibility to a designated team or individual. The exact title or team name may vary — “developer experience team” is common — but the mandate is usually to help improve developer experience (and, as a result, improve developer productivity) by solving problems that frustrate developers and slow down development. This can be anything from standardizing tooling to implementing code review best practices to improving new developer onboarding, and it includes the very important work of helping teams identify and dismantle common bottlenecks.
Remove Blockers By Empowering Developers
Whether or not they have a team or individual responsible for developer experience, the most successful engineering leaders will still ensure that all team members have some involvement in the process of spotting and removing bottlenecks. At the most basic level, you’ll need to involve your team members to contextualize quantitative information. Data is not diagnostic, and though it can point you in the right direction, it’s impossible to know exactly what is happening without talking to your team members.
Your team members will be even more invested if given the opportunity to propose process improvements and take some ownership of their implementation. This collaborative approach ensures that developers understand why certain changes are being made, that they’re on board with new processes from the start, and that they have a vested interest in sticking with them.
As teams work together to remove blockers and optimize processes, each improvement will motivate further improvements. You’ll set a critical engineering flywheel in motion, setting off the Virtuous Circle of Software Delivery, in which developers reap the benefits of improved processes and are motivated to keep seeking opportunities for continued growth and success.
With fewer blockers standing in their way, developers will be happier, more productive, and more likely to excel — and you’ll be one step closer to building a high-performance team.
To find out how Code Climate Velocity can provide the data you need to remove bottlenecks from your engineering pipeline, reach out to one of our product specialists.
Get articles like this in your inbox.
Trending from Code Climate
1.
Engineering Leaders Share Thoughts on Leadership in Disrupted Times in a New Survey
For engineering teams, disruption to the business can have a significant impact on the ability to deliver and meet goals. These disruptions are often a result of reprioritization and budget changes on an organizational level, and are amplified during times of transition or economic instability.

2.
Built In’s 2023 Best Places to Work — Why Code Climate Made the List
At Code Climate, we value collaboration and growth, and strive for greatness within our product and workplace. For us, this means fostering a supportive, challenging, people-first culture. Thanks to an emphasis on these values, we’ve earned spots on three of Built In’s 2023 Best Places to Work awards lists, including New York City Best Startups to Work For, New York City Best Places to Work, and U.S. Best Startups to Work For.

3.
Turnkey Deployment Delivers Day-One Value for Yottaa
Learn how Yottaa gained immediate value from Code Climate Velocity right out of the box.

Get articles like this in your inbox.
Get more articles just like these delivered straight to your inbox
Stay up to date on the latest insights for data-driven engineering leaders.